A large manufacturing company faced many challenges with their Oracle data warehouse, which was deployed on-premises in 2009 with about 120 GB of data.
Over the next 10 years, the application portfolio scaled, bringing the data volumes up to 512 TB, supporting more than 5,000 business processes.
The company’s operations included extract, transfer, and load (ETL) operations and business processes. They had to scale their infrastructure up to 1,500 cores and 20 TB to sustain their operations.
To accommodate the volume of incremental data, the data warehouse team had no choice but to breach the ETL service-level agreement (SLA) defined by the business. And to control the ETL process, they had to purchase hardware every quarter continuously.
Because of these factors, the customer migrated to a cloud-based Massively Parallel Processing (MPP) data platform. They hoped an MPP data platform would result in faster business operations by alleviating ETL performance challenges and improving query execution time.
Mactores Cognition worked with Amazon Web Services (AWS) to migrate the customer from Oracle to their MPP data platform. Mactores is an AWS Partner Network (APN) Advanced Consulting Partner with the AWS Data & Analytics Competency.
Our efforts resulted in a 30 percent lower total cost of ownership (TCO) for the customer’s data platform on AWS. We also tripled the performance for dependent business processes and reports.
In this post, we explain how we selected the optimal migration process for the customer’s needs, and how we carried it out.
How the Customer Used Oracle Data Warehouse
Our customer’s data warehouse served as a central source of information and data analytics platform for the entire company. It gathered information from different systems, including marketing, sales, supply chain, production, manufacturing, and human resources.
During the last few years before they began their migration, the customer’s business units had to access the data in real-time. They needed the data for reporting, historical data, and periodic analysis. In some cases, they used machine learning (ML) to generate predictive outcomes.
The need for real-time data increased the workload on the cluster by about 100x, mostly from complex operations. It also led to a six-fold increase in the user load.
As a result, the customer’s hourly ETL jobs took more time to execute than the SLA for the business. This challenge was aggravated by queries related to business operations that tripled the execution time.
We must perform qualitative and quantitative analyses using variables to build a production migration strategy. Our variables were data types (structured, unstructured), data scale, and frequency (volume, variety, and velocity of data).
In consultation with our customer, we decided a proof of concept (PoC) with specific success criteria would be the next step. Once we completed the PoC, we’d be able to learn the pitfalls and foresee the risks, of a production migration of all business operations to Amazon Redshift.
In the following sections of this post, we will recount our work on the PoC. Our process involved migrating from the Oracle data warehouse to Amazon Redshift, migrating ETLs to Matillion, and accessing multiple AWS services.
What We Learned
Mactores discovered many facts about the current operating ETL jobs during the proof of concept. Many of the jobs were extensive and non-repeatable, and a few were complex. These factors added man hours to the migration process and migration time.
In addition, the business team changed the data warehouse and ETL jobs while the migration was in progress. We had to come up with a strategy to catch up with the backlog during the migration.
The reporting system also used non-standard reporting techniques. These added significant manual effort to refactor some of the legacy functions into Redshift.
Remodeling the Schema Structure
The data warehouse storage architecture was changing from row-based (Oracle) to column-based (Amazon Redshift). We had to put effort into remodeling some of the schema structure.
In particular, when we migrate Oracle Data Warehouse to Amazon Redshift, we have to re-evaluate distribution keys and sort keys. We also have to change the table structure.
This particular customer had a complex schema of tables with primary and foreign keys with relational tables, and many-to-many relationships in a data warehouse design.
When we evaluated them for migration, we realized that a “lift and shift” of the data warehouse schema would not work. Instead, we’d have to use an even distribution style. This is because there were many interdependent TB-size tables that would result in too much network input-output (I/O) between Amazon Redshift nodes.
In our experience, lots of Oracle customers design data warehouses with Type 1 slowly changing dimensions (SCD) and complex relationships. This results in a loss of the data required for machine learning.
Our Approach to Migration
The migration plan by Mactores had to accommodate, with zero production downtime, the requirements we identified in our POC.
We decided on a plan with these critical tasks:
-
Copy the initial data from the on-premises data warehouse production environment to an Amazon Redshift development environment for testing.
-
Migrate and create ETL jobs throughout the migration and use the development environment to test the ETL scenarios.
-
Take the latest copy of on-premises data warehouse production data and migrate it over to Amazon Redshift. Do this until the Data Freeze Date, which is the date from when the Oracle systems are used by both ETL systems to update the source database and Amazon Redshift in parallel.
-
Use the new ETL jobs to update Amazon Redshift from the source system while the old ETLs are updating.
-
Perform business validation on Amazon Redshift and identify a cutover date to migrate all the users.
Collaborating with our customer, Mactores folded the preceding steps into a migration plan that consisted of five major milestones:
- Data warehouse discovery and data evaluation.
- Data warehouse remodeling.
- Data and ETL migration.
- Reports and business process migration.
- Go live.
Milestone 1: Data Warehouse Discovery and Data Evaluation
Our data architects analyzed the Oracle data warehouse for input data sources, data ingestion pipelines, and data transformation requirements. They also analyzed it for the final data model required by the customer’s business processes and reports.
This analysis led to a collaborative effort between Mactores and our customer to start remodeling data warehouse and ETL processes. That effort identified challenges with three data warehouse components:
-
Input data sources
-
Data ingestion pipelines
-
Data consumption
Challenges with Input Data Sources
Our customer had multiple source data systems that were committing data to the Oracle data warehouse. These included online transaction processing (OLTP) systems, document databases, and flat files.
For instance, the Sales business unit used brand performance, primary, secondary, and retailer sales information. They obtained this data from Oracle E-Business Suite, AC Nielsen, IMRB, Media, and Copa.
In addition, they were expecting more data sources and significant amounts of data to be processed shortly. When data sources and footprint continuously increase, they pose a challenge to most data solutions' return on investment (ROI).
Our customer’s executive team expected our efforts to produce a balanced TCO and ROI. Amazon Redshift can quickly analyze complex data stored in an Amazon Simple Storage Service (Amazon S3) data lake with Amazon Redshift Spectrum. It was an ideal choice to keep the costs of the growing data footprint low.
Challenges with Data Ingestion Pipelines
Part of the data ingestion pipeline involved the concurrent processing of data. These micro-batch processes were ingested every 15 minutes.
The pipeline also ingested multiple, long-running ETL processes. These extracted data from the Oracle business applications and primary, secondary, and tertiary datasets.
When the customer first set up the Oracle data warehouse on-premises, each job would execute in about four hours. After the data volume grew from GBs to TBs, the time it took to execute a job grew from four to 12 or 13 hours. This did not meet the SLAs prescribed by the business.
Challenges with Data Consumption
Both data scientists and business analysts were consuming the data to generate business insights and forecasts. On multiple occasions, these queries included datasets from multiple quarters, years, or as much as a decade.
Scheduled reports and dashboards, including canned reports and KPIs, were consumed by users in organizations as diverse as management and field operations. These users were challenged to make decisions on the supply chain, product quality, and customer feedback in an acceptable timeline.
Furthermore, management had decided to implement a dashboard for everyone, and real-time reporting for all business units. These factors made it impossible for an on-premises data warehouse to meet SLAs.
Milestone 2: Data Warehouse Remodeling
Due to these challenges, we concluded that we could not simply conduct a lift and shift migration from the Oracle data warehouse to Amazon Redshift. We had to meet the performance challenges and optimize TCO.
We recommended that we remodel the data warehouse and re-architect the ETL processes instead of a lift and shift migration.
For the data warehouse migration, Mactores used the AWS Schema Conversion Tool (AWS SCT). It converts the source database schema and a majority of the database code objects, to a format compatible with Amazon Redshift. This includes views, stored procedures, and functions.
AWS SCT generated an assessment that helped identify the complexity of the migration for different objects. These included data types, UDFs, and stored procedures. Using this tool, we migrated the PRD schema of the Oracle database into Amazon Redshift.
Then, we migrated the PRD data from the Oracle to the DEV environment on Amazon Redshift.
The Oracle database and Amazon Redshift had fundamental differences so, we had to remodel the data warehouse structure. The primary difference between the Oracle database and Amazon Redshift is that Redshift is designed to support as a MPP data warehouse.
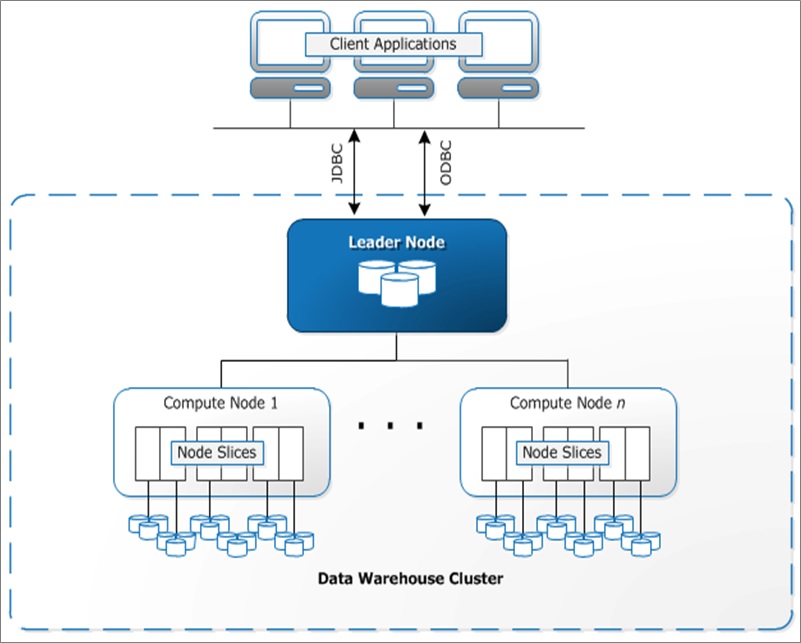
Figure 1 – Amazon Redshift cluster architecture (MPP).
Another major difference between the data warehouses is the data storage architecture. The Oracle database is architected as a row-based data store. Amazon Redshift is a columnar data store, which supports its massive compression capabilities.
The figures below show how row-based and column-based storage is structurally different.

To migrate efficiently to Amazon Redshift, we analyzed various aspects of the operational Oracle data warehouse.
The most critical aspects we analyzed were:
- Long-running queries.
- Joins between dim tables and fact tables.
- Upsert (update and insert) and data refresh strategy.
- Primary and unique keys for most-used tables.
After analyzing these aspects, we designed a comprehensive Amazon Redshift data model. The model supports columnar storage and multi-node distributed tables by defining a table distribution style, distribution keys, and sort keys.
These critical efforts helped our customer keep the Amazon Redshift costs low and provide triple the performance compared to the Oracle data warehouse.
After we analyzed longer running queries, our team identified the tables and joins that were impacting performance. We chose the appropriate compression, depending upon the data types, to improve the query performance.
Because there was less data to scan or join on, I/O usage was limited, which increased the query execution speed. This also reduced storage utilization. Because the file compression reduces the data footprint size, the customer required less disk on the cluster nodes.
Pricing Model and Performance Improvements
The Amazon Redshift pricing model is different than traditional on-premises licensing models and offers significant savings and flexibility.
To compare the cost, Mactores chose to look at the price for storing 1 TB of data for one year ($ / TB / Year). With a three-year commitment for the dc2.8xlarge nodes, at the time of the migration, the price dropped by 30 percent. That price drop was a game-changer in the data warehousing world.
Considering the 2x data growth every year, it was important to focus on performance improvements. Managing performance is a greater challenge as the volume of data grows.
Growing data volume, coupled with the need to maintain multiyear historic data, can quickly become expensive. To balance cost with performance, we recommended the customer adopt a lake house approach to data warehousing.
The lake house would use Amazon Redshift Spectrum to query archived data from an Amazon S3 data lake. Our analysis discovered that 10-15 percent of the queries were consuming data more than three years old. We suggested a policy of archiving data more than three years old in Amazon S3.
Redshift Spectrum helped balance the cost of the Amazon Redshift cluster with the need to query historical data faster. All within a single data warehouse environment.
Milestone 3: Data and ETL Migration
As explained earlier, Oracle and Amazon Redshift were structured differently. Migrating ETL jobs into Amazon Redshift “as-is” was not feasible, so we had to remodel the data warehouse. We evaluated several remodeling tools, and found that Matillion was the best.
Matillion, an AWS Data & Analytics Competency Partner, provides extensive transformation and orchestration components for Amazon Redshift. Its tight integration with many AWS services also made it the platform of choice for our customer.
Using Matillion, we designed an ETL framework to support high fault tolerance. Matillion also monitors systems to generate alerts when a job’s data quality succeeded for failed. It allows us to continuously develop and deploy ETL jobs, and tracks data lineage.
We designed additional transient ETL jobs to support the data migration from existing tables to re-modeled tables during the cutover phase.
Our data and ETL migration milestone had three critical considerations:
-
Multi-cut data migration
-
Data extraction
-
Data validating and testing
Multi-Cut Data Migration
We recommended a multi-cut migration strategy to our customer, which migrated all of the data from the source system to Amazon Redshift in two phases:
-
Migrate data from Oracle to Amazon Redshift, keeping the same schema/data model.
-
Migrate delta data from Oracle to Amazon Redshift using new ETLs from the cutoff date.
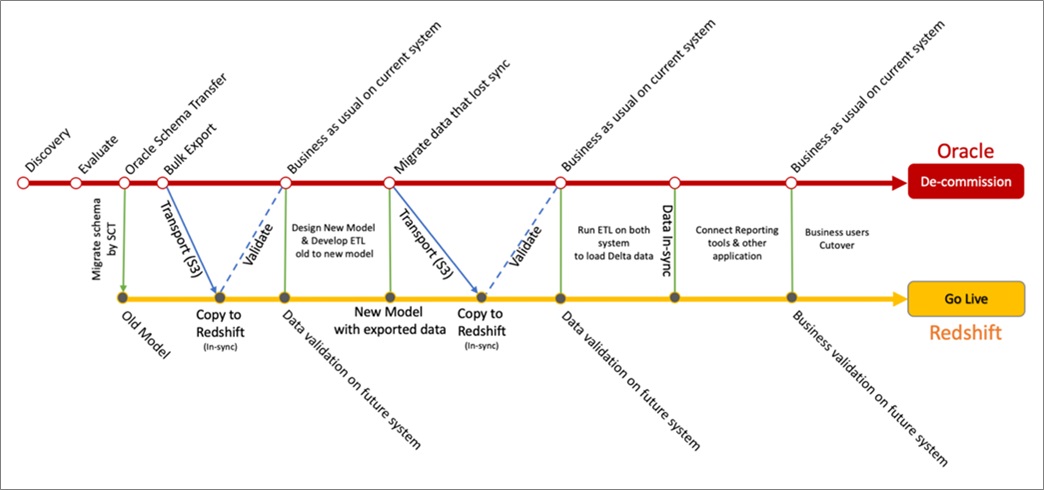
Figure 5 – Multi-cut source to Amazon Redshift migration plan.
The initial data migration phase kept the data model similar between the two systems. This similarity allowed data modeling experts to remodel the data warehouse, and ETL developers to migrate data from the old model to the new.
ETL developers also maintained intermittent jobs to transfer data from the old data model to the new.
Mactores used the AWS SCT to migrate data out of Oracle to Amazon Redshift. As a best practice for sizing the data extraction agents, we used one data extractor agent per 1 TB of data on the source system.
Data Extraction
We carried out data extraction tasks in parallel with the migration of the Oracle database tables. We did it on a table-by-table basis, using the deployed extraction agents from the AWS Schema Conversion Tool.
These extraction agents first authenticate users to make sure they have access to the data source. If they do, the agents allow users to adjust the resources available to them during the extraction.
The AWS SCT agents processed the data locally and uploaded it to Amazon S3 through the network (via AWS Direct Connect). For tables with more than 30 million rows or 1 TB in size, we used the virtual partitioning feature on AWS SCT. It creates several subtasks and parallelizes the data extraction process for this table.
We created two groups of tasks for each schema that migrates: one for small tables, and another for large tables using virtual partitions.
Data Validating and Testing
Once we loaded the initial extracted data into Amazon Redshift, we validated the data. We conducted the data validation tests in parallel, using the validation scripts we developed during the migration.
The goal at this stage is to validate production workloads, comparing the Oracle data warehouse to Amazon Redshift outputs from the same inputs.
We started ETL development for the new data model once a copy of the Oracle system was available. This approach allows ETL developers to validate the ETLs and maintain data quality and consistency between the two data models.
We began the second phase of data migration after the ETLs were validated with a data quality check and a performance check. This two-phase approach helped us remodel the data warehouse and migrate with no downtime to Amazon Redshift.
We scheduled the newly-designed and tested ETL jobs to migrate differential data (data from the last full migration) to Amazon Redshift. Later, the same jobs continued migrating the incremental data directly from the source systems.
Milestone 4: Reports and Business Process Migration
We then connected Tableau (a reporting and dashboarding tool used by our customer) to Amazon Redshift. Tableau Software is also an AWS Data & Analytics Competency Partner, and it helped us analyze the reports that we had to redesign so we could accommodate the change in the data warehouse remodeled schema.
Also, to achieve higher concurrency between business processes dependent on the data warehouse reports/dashboard, we optimized Amazon Redshift Workload Management for:
-
Scaling workloads by giving them enough resources (concurrency and memory).
-
Isolating and protecting their predictable workloads (batch operations) from the unpredictable workloads (ad hoc queries from reporting tools).
Workload Migration Strategy
To design the new workload management strategy, we decided to:
-
Separate users.
-
Define workloads.
-
Group users into workloads.
-
Select slot count and memory percent (%) per queue.
-
Use short query acceleration (SQA) for small queries.
Business Validation
First, we successfully migrated the data and validated its quality ourselves. Then we invited users from multiple business units across the company to access the Amazon Redshift data warehouse.
Business users validated the feasibility of the Go Live cutover. They relied on a variety of tools and methods, including JDBC/ODBC clients, Python code, SQL procedures, and custom applications.
Milestone 5: Go Live
Until the system went live, both the Oracle data warehouse and Amazon Redshift were running in parallel. Once the testing was complete and accepted, business users and business processes were redirected to Amazon Redshift.
Then, the old system was decommissioned.
Conclusion
Mactores used a five-step approach to migrate, with zero downtime, a large manufacturing company from an Oracle on-premises data warehouse to Amazon Redshift. The result was lower total cost of ownership (TCO) and triple the performance for dependent business processes and reports.
The migration tripled the customer’s performance of reports, dashboards, and business processes, and lowered TCO by 30 percent. Data refresh rates dropped from 48 hours to three hours.
Our customer was able to use Amazon Redshift Spectrum to query multiple years of data without waiting for an unarchival process. As a result, they could run multi-year queries anytime they wanted to.
Migrating to the Type 2 slowly-changing dimensions available with Amazon Redshift, our customer was also able to access machine learning modes. This helped them create intelligent forecasting models.How Mactores Tripled Performance by Migrating from Oracle to Amazon Redshift with Zero Downtime.